
Tips for Excel, Word, PowerPoint and Other Applications
Inserting Excel Tables in PowerPoint
Why It Matters To You
While Excel is a great analytical tool, we often rely on PowerPoint for presentation and discussion documents. So how do you easily get table data from Excel to Powerpoint? So why not just Paste Special as an Excel object or as a graphical element? To the first point, you don't have as much formatting control over an Excel object as you do a PowerPoint table and if you intend to add information, a graphical element doesn't work either. If you expect your data to change on a regular basis however, you might want to consider a linked Excel object, but you'll have to weigh those trade offs for yourself.
How To ...
I'm going to construct a sample table in PowerPoint. I was out shopping for washers the other day, downloaded some comparative data from Best Buy, and put it into Excel. Now, we'll go from a data table in Excel to a nicely formatted table in PowerPoint. While you may not use the same formatting standards in your work, the process is the same and i encourage you to try out different things and figure out for yourself what works.
For this exercise, we're going to use 2 sample files:
- excel-ppt_table.xls - my source Excel file
- excel-ppt_table.ppt - my resulting PowerPoint table file
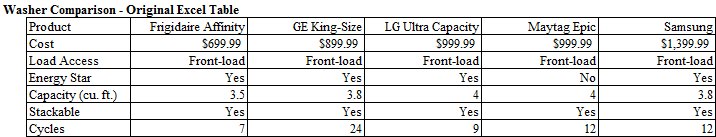
Step 1 - Adjust Excel Formatting
Remove any number formatting, tabs, shading, etc from your Excel table as some of it may carry over to your PowerPoint page. This isn't a hard and fast rule. As you gain experience with the process, you'll learn what formatting will carry over consistantly and adjust your formatting accordingly.
Set the number of decimal places to what you need in Excel as PowerPoint does not have this feature in tables.
Here's my data set before formatting ...
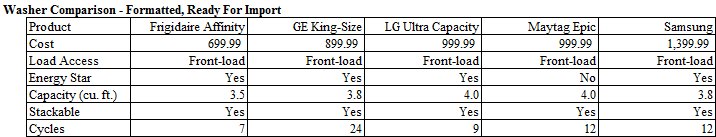
... and after ... not a ton of work involved here.
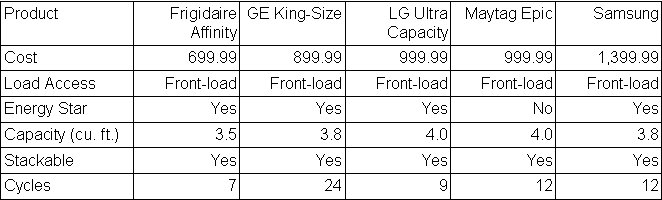
Step 2 - Insert the Excel Table as a PowerPoint Native Table
Paste the Excel Table into PowerPoint. On the bottom right hand side of the table click on the clipboard icon and select table if it is not already.
Select the entire table by clicking in any cell and the clicking on the gray border around the entire table.
- Set the font to Arial
- Set the font size to 12 point
- With the entire table still selected choose Table for the Format pull down menu. Under the Text Box tab set left, right, top and bottom all to .03 (note: adjust these numbers based on the size of your table)
Roughly adjust the table to fit in the target area you need you table to be in.
Your table should look roughly like this now. It will actually look a lot clearer if you're actually looking at the sample PowerPoint file.
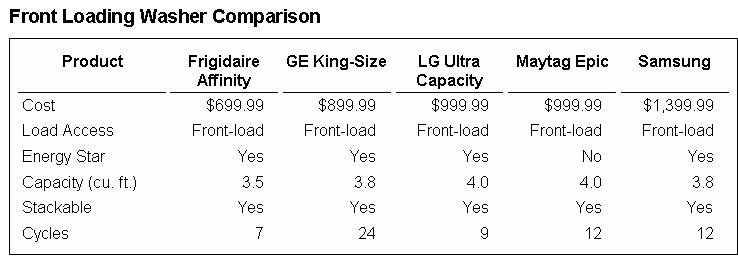
Step 3 - Finish Formatting Your Table
Every company or organization is going to have their own formatting standards. The guidelines below are what I use, but you'll need to figure out what your company uses. As a general rule though, keep the formatting to a minimum. Excessive shading, poorly thought out bordering, etc actually detracts from your message.
- Add a backer box. The backer box is just a simple rectangle behind your table and help to frame the table as a page element, rather than using cell border formatting, which should be used to differentiate specific cells in the table. You can also add drop shadows if this floats your boat.
- Add a table title and units of measure as needed. Remember, all pages needs to stand by themselves. The table title and units should make clear to any reader the purpose of the data.
- Number Units should only be on totals and on the first item of a column. This helps reduce some of the noise on a page.
- Column headers should be bold and center justified.
- Blank columns should be inserted in-between each column of data. Insert a new column by highlighting a column of data, right click, and then select Insert Column. Double click on the right column line of that column to minimize that column. I like to do this because it helps to separate and distinguish columnar elements.
- All line widths should be ½ pt. I'm typically a fan of keeping line and border widths consistant.
- Left align numbers and adjust the cell padding for each column to roughly center the largest number in the column. It's generally easier on the eye and easier to follow if everything is centered under the header.
My table now looks like this.
Notes
| Last updated | 9/5/07 |
| Application Version | Excel 2003, PowerPoint 2003 |
| Author | Michael Kan; original material written by Ronda Bey for Silver Oak Partners |
| Pre-requisites | Basic knowledge of PowerPoint and ability to create rectangles and text boxes |
| Related Tips | Saving PowerPoint Tables as Graphical Images |